Monday, August 29, 2011

Azure Design Patterns

I'm reading: Azure Design PatternsTweet this !
I have been very busy these days with personal matters, and have not been able to extract time for blogging. I apologize to my readers for the same. Microsoft Azure cloud environment is a rapidly growing cloud platform. With the release of Hadoop connectors for SQL Server, support for Hadoop implementations and Azure Table Storage, Azure provides a reasonable support for unstructured data which is going to be the need of the future. But along with this one more area is growing largely that churns our lot of business and effectively lot of data too - Social Media.

Microsoft has newly released Windows Azure Toolkit for Social Games version 1.0. Integration with social media has become a necessity for almost every other sizable organization today. LinkedIn is one of the best examples where organizations are trying to hook in the social connections of employees for a more intelligent recruitment. Going social is one of the best moves by Azure team.

Azure is classified more from a compute and storage criteria, but from different perspectives of development if would make sense to categorize it into more detailed criteria. When you speak of development, design pattern eventually comes into picture, thou in database world it is used less compared to application world. Buck Woody has put up a very nice website to study these design patterns, and I feel its definitely worth checking out. Its called Azure Design Patterns.

Sunday, August 21, 2011

Using Graph Database on Windows Azure

I'm reading: Using Graph Database on Windows AzureTweet this !
Unstructured data is the newest and most vibrant source of data, that organizations want to mine for rich business intelligence. SQL Server and Sharepoint and the front runners from the Microsoft platform in the field of BI. SQL Server being a RDBMS, is not the right choice to contain unstructured data and Sharepoint itself can generate and contain huge volumes of unstructured data. New categories of databases like Document database, Key-Value pairs, Graph databases etc are suited for these purpose and from here starts the territory of NoSQL movement.

Microsoft Azure platform is supporting Hadoop implementations, SQL Server interoperability drivers for Hadoop has also been announced, Microsoft Research is trying to develop project Dryad, which are all movement towards building capabilities to support unstructured data. Graph databases are one of the prominently used database types in the world of unstructured data. Many would argue why relational database cannot be used to achieve the same what graph databases are used for ?
Here is one of the answers for the same. Graph databases apply graph theory and once you understand the same you would find the reason why RDBMS cannot cater what Graph Databases can. Neo4j is one of the leaders in this area. Industry leaders like Google also have their own implementation of graph database know as Pregel.

sones GraphDB is one of the graph databases of choice for Microsoft professionals, as it is developed using .NET and is easily supported on Azure platform. Huge volume of unstructured data needs flexible compute and storage platforms like Azure cloud platform, and as it is using .NET framework behind the scenes, it is ideal to be hosted on Azure platform. You can access the technical datasheet from here and below is the architecture diagram of the same. Interestingly this brings a new query language for DB professionals, GraphQL !!

Sunday, August 14, 2011

Unstructured data in SQL Server Denali

I'm reading: Unstructured data in SQL Server DenaliTweet this !
Microsoft seems to be floating support for unstructured data in bits and pieces, which increases its sustainability towards the upcoming challenges posed by BIG and unstructured data. RDBMS is going obsolete gradually, and BI professionals are almost abandoning plain vanilla RDBMS, which I have explained in my latest article. Many would think that RDBMS is a de-facto data container, but world of data is changing with the exponential growth in organizational data. No SQL, CAP Theorem, BASE standard, Distributed databases etc are shaping up a new pandora of unstructured data management and many IT frontiers have already started exploring this part of the database world and harnessing the benefits out of the same.

SQL Server Denali is adding the following new features in the DB Engine to support storage and management of unstructured data:

1) Lots of performance and scale work in Full-Text Search!

2) Customizable NEAR in FTS

3) The ability to search only within document properties instead of the full document

4) Semantic Similarity Search between documents. This provides you the ability to answer questions such as: "Find documents that talk about the same thing as this other document!"

5) Better scalability and performance for FileStream data, including the ability to store the data in multiple containers

6) Full Win 32 application compatibility for unstructured data stored in a new table called FILETABLE. You create a Filetable and can drag and drop your documents into the database and run your favorite Windows applications on them (e.g., Office, Windows Explorer).

These capabilities are definitely steroid level additions for front-end applications to manage unstructured data, but still I feel that Hadoop connectors which would facilitate interoperability between SQL Server and Hadoop is worth more than the entire DB engine. Petabyte scale analytics over structured and unstructured data, is still not a cup of tea for any RDBMS DB Engine. Still these features supporting management of unstructured data in the RDBMS parlance are good value additions. You can learn about these features from this webcast.

Tuesday, August 09, 2011

MS BI and Hadoop Integration using Hadoop Connectors for SQL Server and Parallel Data Warehouse to analyze structured and unstructured data

I'm reading: MS BI and Hadoop Integration using Hadoop Connectors for SQL Server and Parallel Data Warehouse to analyze structured and unstructured dataTweet this !
Not-only SQL (No SQL) is ruling the world of unstructured data for data storage, warehousing and analytics, with Hadoop being the most successful and widely used technology. There are two choices you can make when something is gaining immense acceptance: either you can abandon and keep competing with your own league or you can partner with it and extend your reach deeper. Microsoft is without doubt one of the leaders in database management, data warehousing and analytics apart from IBM, Oracle and Teradata, but on structured data only. Microsoft Research is trying to churn out its own set of products to deal with BIG data and unstructured data challenges, using federated databases capable of MPP. But Hadoop has already earned a proven reputation and acceptance in this world of unstructured data.

The good news is that Microsoft is embracing Hadoop environments slowly and adopting a symbiotic policy. No organizations would have exclusively structured data or exclusive unstructured data, it's always a combination of both. Azure platform is already support Hadoop implementations. Recently Microsoft announced an upcoming CTP release of two new Hadoop connectors for SQL Server as well as Parallel Data Warehouse. Many visionary DW players are already offering a hybrid BI implementation that allows to use MapReduce (used to query data from Hadoop environments) and SQL together. With the release of Hadoop connector for SQL Server, its highly probable that SQL Server becomes a source for Hadoop environments rather than vice-versa as the ocean full of unstructured data sits in Hadoop environments which is nowhere in the reach of SQL Server to accomodate.

Still the interoperability facilitated by this connector, would empower SQL Server to extract data of interest from this ocean of data hosted in Hadoop environments, making MS BI stack even more powerful. Database Engines, ETLs as well as OLAP Engines would see bigger challenges than ever when clients start using Hadoop as a source for SQL Server, but my viewpoint is that it would mostly work other way round. These connectors are opening a door to the possibility where SQL Server based databases as well as data warehouses can/would be used in combination with Hadoop and MapReduce, effectively creating new opportunities for the entire ecosystem of database community from clients to technicians.

Its too early to know the taste of the food before you actually taste it, but you can predict about the taste from the flavor, and that's what I am trying to do as of now. You can read the announcement about these connectors from here.

Sunday, August 07, 2011

Columnar Databases and SQL Server Denali : Marathon towards being world's fastest analytical database

I'm reading: Columnar Databases and SQL Server Denali : Marathon towards being world's fastest analytical databaseTweet this !
Have you ever heard of what are columnar databases? You might be wondering this is something new - The answer is No and Yes. Columnstore is not a new technology that has evolved suddenly and is making waves in the database community. It has been in the industry for quite some time. Generally database stored data in the form of records which resides in tables. The storage topology is typically known as rowstore as records are physically stored in a row based format. This methodology has its own advantages with OLTP systems and limitations with OLAP systems. The main advantages of columnstore are better compression, reduced IO during data access and effectively huge gain in data access speeds. Scaling data warehouse computing resources by scaling memory resources and using massively parallel processing does not fit with every business due to budgetary and architecture constraints. Columnstore seems to be a breakthrough technology to play the role of a catalyzer in analyzing enormous amount of data of the scale of billions of records, from enterprise data warehouses.

One of the best examples of columnar database success stories is ParAccel - one of the world's fastest analytical database vendors. Gartner in its latest report, has positioned ParAccel in visionaries category in the magic quadrant. You can get a deeper view on how ParAccel harnesses the power of columnar storage from it's datasheet and a success story.

Microsoft seems to have started its marathon in adding the nitro to SQL Server for adding data access speeds to DBs for OLAP engines. SQL Server Denali is introducing a new feature known as columnstore indexes, know as project Apollo and you can read more about this from here. This is just the first spark in the race of being one of the worlds fastest analytical database, a market into which IBM, GreenPlum, Kognitio, ParAccel and others have already plunged quite some time back. In-memory processing engine like Vertipaq combined with columnstore indexes can yield some blazing speeds in data warehousing environments. Time would tell what is the strategy of Microsoft to incorporate this concept in SQL Server and how SQL Server community reacts to it. Whatever be the case, it's a welcome news for end clients as of now.

Wednesday, August 03, 2011

Geospatial Reporting and Analytics using Analyzer

I'm reading: Geospatial Reporting and Analytics using AnalyzerTweet this !
Data representation has many forms. The intended method and purpose of analysis as well as the nature of the data will determine which form of data representation is most appropriate. With the growing need for better analytics, reports today are increasingly expected to be interactive enough to facilitate analysis.

When it comes to geospatial reporting, the first challenge is to associate two entities together – Data and Geography. Geography is usually represented on a map, and associating data to a map requires a geographical element in your data to associate the two entities with each other. Reporting geospatial data is not something new, but reporting it intelligently requires some reasonable effort, and in this Analyzer recipe, we would take a look at what is the difference between reporting geospatial data and reporting the same in an intelligent manner.

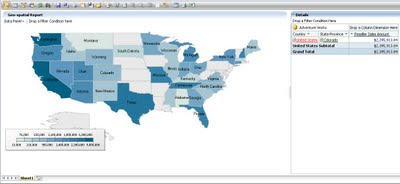
Analyzer has two fundamental reporting controls related to this discussion – Intelligent Map and Pivot Table. To create a geospatial report, I used the “Reseller Sales Amount” measure as the data, the “Geography” hierarchy of the Geography dimension from the AdventureWorks cube, and added the same to the Intelligent Map control. Side-by-side I added a Pivot Table control and added the same entities to it. Effortlessly I created a geospatial report with a lot of built-in features provided out-of-box. The Intelligent Map control consists of a reasonable number of different maps including the world map, which I have used in my report. Many additional maps are available free of charge on the Internet. Strategy Companion has a list of some of the web sites where you can find these maps, which use the Shapefile format (.shp extension) created by ESRI, a well-known GIS company.

The first question that may come to mind is why is the pivot table added to the report, when a map is already there? The Intelligent Map control actually is quite intelligent as we will see through the course of our demo. The first point of intelligence is that, just from the Geography hierarchy, this control has associated all the locations correctly on the map. When you would hover over a particular area, you can see the associated data value in the tool tip. The feature that makes me happy is that it provides an out-of-box drill-down feature. The reason for having the pivot table is that if the user intends to figure out the point of analysis, all information would be required at a glance and the user cannot be expected to hover everywhere. So the pivot table acts as the data coordinates for the geospatial representation of the report.

To take this to the next level, double-click the report to drill down to the next level in the hierarchy of the selected area. The difference in color shows the performance of the area and the same can be measured from the scale shown on the report. Analysts would generally use the very intuitive and visual approach of figuring out the area of interest based on the varying shades of colors (you can also choose to use several different colors such as red, yellow, and green) and then get into the numeric details. The pivot table is also capable of drilling into the data and you can get all the details from there. You may also choose to expose one region’s details on the map while simultaneously showing the details for another region on the pivot table.

Pivot tables (also commonly called grids) are generally used for slicing and dicing of data, and geospatial representation of the data is used for distribution analysis of data over a selected geography. One problem from the above report is that you would not find names represented on some areas, also some areas might be very small from a geography perspective. In the pivot table you would find a long list for State-Province under United States. So how do you associate these two? The answer is “Manually”, as there is no association between these two parts of the report. Ideally after drilling down the geography, data distribution has become large, so geospatial representation is convenient for users to select area to start slicing-dicing. But this needs both types of the report components to work in harmony.

With this comes the challenge of usability, interactivity and intelligence all at the same time. The Intelligent Map control is capable of addressing these challenges. In the below screenshot you can see that this control can be set to support slicing-and-dicing data as the primary objective. Also the scope of actions on this control can be specified, which gives the flexibility to associate the actions performed on this control on different parts of the report.

After configuring this control, check out the report. Drill down on “United States”, and you would find that not only the map has gotten drilled down to the lower level, but the pivot table also works in harmony with the selected geography. I selected “Colorado” and on the grid the same got selected readily. Users do not need to scroll long lists to locate the area which they selected on the map for analysis. With an interactive Intelligent Map and Pivot Table, both capable of drill-down and drill-through features, and capable of working in harmony, users almost have a gadget in the form of a report, to perform slicing-and-dicing driven by geospatial analysis.

From a Microsoft BI products perspective, the ingredients I would need to create this geo-spatial recipe are: SSRS Bing Maps control, Grids (SSRS Tablix / PPS Analytical Grid) with drill-down and drill through enabled and connected using Sharepoint webparts. And still making them work in the same harmony as shown above would not be as effortless as this. Of course, each platform has its own advantages and limitations. To explore what more Analyzer has to offer compared with other reporting tools, you can download an evaluation version of Analyzer from here.

Tuesday, August 02, 2011

SSIS on Cloud with SQL / Windows Azure : Future Applications

I'm reading: SSIS on Cloud with SQL / Windows Azure : Future ApplicationsTweet this !
Generally cloud and ETL have a typically known application of facilitating ETL, which mostly harnesses the elasticity of computing resources. ETL on cloud is ideal for applications where data is already stored on the cloud. Regular line of business applications would process data from OLTP sources and load the data on another data repository on the cloud. For ETL to source and load data from in-premise data sources, WCF and related RIA services are employed. Using Amazon EBS cloud and customized VM images, you can setup your ETL on cloud and Amazon EBS out-of-box supports SSIS standard version. Right when Azure was in it's CTP, I had authored two articles on SQL Azure, on how to read and write data to SQL Azure using SSIS and SSRS 2008 R2. But this is something that is already well-known. What's new ?

Semantic Web, Unstructured Data and technologies that store, process, analyze, warehouse such data and extract intelligence out of the same is the new challenge that is at the horizon of the IT industry. Few front line IT majors have tsunami sized data generated everyday due to the virtue of popularity of social media, and such organizations like Google, Yahoo, Facebook, etc have already started wrestling with these challenges. The benefits of processing unstructured data, and driving your business based on the extracted intelligence are very clear from the example of these companies where they within a duration less than a decade, their advertising revenues are worth billions and still skyrocketing. All standard business house have lots of unstructured data like emails, discussion forums, corporate blogs, recorded chat conversations with clients etc. Organizations generally have aspirations to build a knowledge base for all the different areas of business functions, but when they start seeking consulting on the strategy to implement the same, they find themselves in a whirlpool of processes and financial burdens. Unstructured data has the potential to generate data for such knowledge base.

Still the question in your mind would be, what has this to do with SSIS and Azure? Regular applications of SSIS are known to everyone, and more than that professionals would be knowing that SSIS is not supported on Azure cloud platform, which might be the motivation of reading this post as the subject line reflects that is might be supported now. SSIS is an in-memory processing architecture, and implementing the same of shared / dedicated cloud environments has its own challenges. I am also sure that SSIS Team must be on its way to bring it to the crowds in the time to come. But my interest in on the future application of SSIS on unstructured data, and hosting it on Azure cloud platform.

When SSIS would gain such capability, applications like Extractiv would be common across enterprises. To build application like Extractiv using SSIS, solution design would be too crippled as SSIS is not inherently blended with cloud. One day I would like to see SSIS packages getting executed as a crawler service in Sharepoint, which would crawl entire site and data on Sharepoint portals like FAST Server, extract entities from unstructured data and populate next generation of warehouse on the Azure cloud platform, that would be queried using LINQ for HPC kind of technologies. For me, applications like Extractiv are very fascinating, as they inspire to foresee ideas, that are window to opportunities which most are not able to envision right now.
Related Posts with Thumbnails